
Here at Scout APM, we are extremely excited to announce our Node.js monitoring agent is now part of our host of monitoring agents (apart from our Ruby, Python, PHP, and Elixir agents of course!). Now that we have brought a low-overhead monitoring agent to the expansive world that is Node.js, we wanted to show all of you folks how easy it is to get started, as well as highlighting the main features of our agent.
Setup
To get started monitoring your Node.js applications you will need to signup for a Scout account. If you don’t have one already, you can sign up for a free 14-day free trial (no credit card required) here.
The next thing to do is to add the monitoring agent to your project’s dependencies, this can be done with a single command in your shell:
# install via yarn
$ yarn add @scout_apm/scout-apm

# install via npm
$ npm install @scout_apm/scout-apm
The next thing to do is to define some configurations settings to link the agent to your account. There are two ways to do this, you can either set your Scout APM key and name in your environment variables your can pass them into the scout.install() function. To do that, open up your project’s .env file in your text editor of choice and add the following three lines to the end of the file:
SCOUT_MONITOR=true
SCOUT_KEY="enter the Agent Key here"
SCOUT_NAME="enter the name of your application here"
You can find your account’s Agent Key on the settings page of Scout.
Afterwards, go into your Express middleware, or initialize express and set the app to use Scout, and have Scout install.
const express = require("express");

// Require scout-apm after express, but before all other requires.
const scout = require("@scout_apm/scout-apm");
const pg = require("pg");

// Initialize your express application
// The "main" function
async function start() {
    // Trigger the download and installation of the core-agent,
    // pass in the configuration values if you have not explicitly
    // set them in your environment variables
    await scout.install({
        allowShutdown: true, // allow shutting down spawned scout-agent processes from this program
        monitor: true, // enable monitoring
        name: "",
        key: "",
    });

    // if you set the SCOUT_KEY and SCOUT_NAME in your enviornment variables,
    // you don't have to pass anything into scout.install()
    // await scout.install()

    // Initialize your express application
    const app = express();

    // Enable the app-wide scout middleware
    app.use(scout.expressMiddleware());

    // Add other middleware and routes
    // app.use( ... )
    // app.get( ... )

    // Start express
    app.start();
}

// If this script is executed directly, run the start function
if (require.main === module) { start(); }
And that’s it! Deploy/Restart your app and after approximately 5 minutes, your data will start to appear in Scout. For more information about Heroku installs or to troubleshoot installation problems, either take a look at the documentation. If you run into any issues please shoot us an email on support and we’ll be happy to help.
Where to start?
So you’ve created a Scout account, hooked up the monitoring agent, and the data is now flowing. That’s great and all, but isn’t the reason you joined Scout is to diagnose your application’s performance issues? So how do we do that? Let’s take a look at the main features of Scout which can help you to understand your performance issues quickly.
Your app’s main overview page
When you first access your app, this is the main page that you are presented with. Here you can gain insight into your average response time, your more lengthy 95th percentile response times, throughput, errors, memory, and apdex.
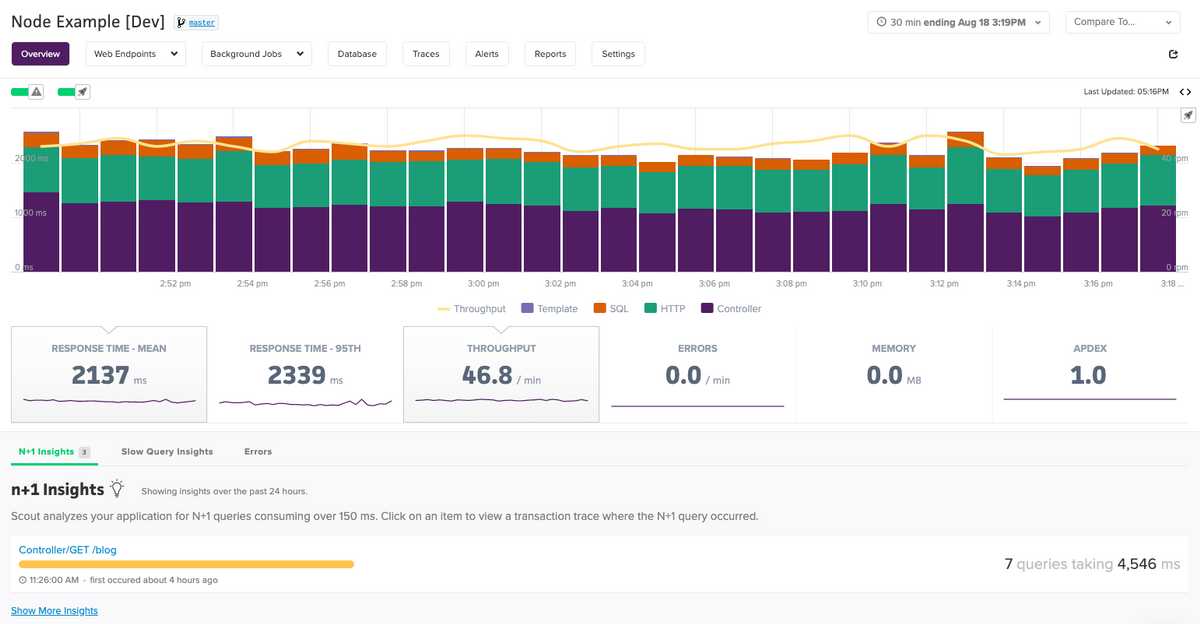
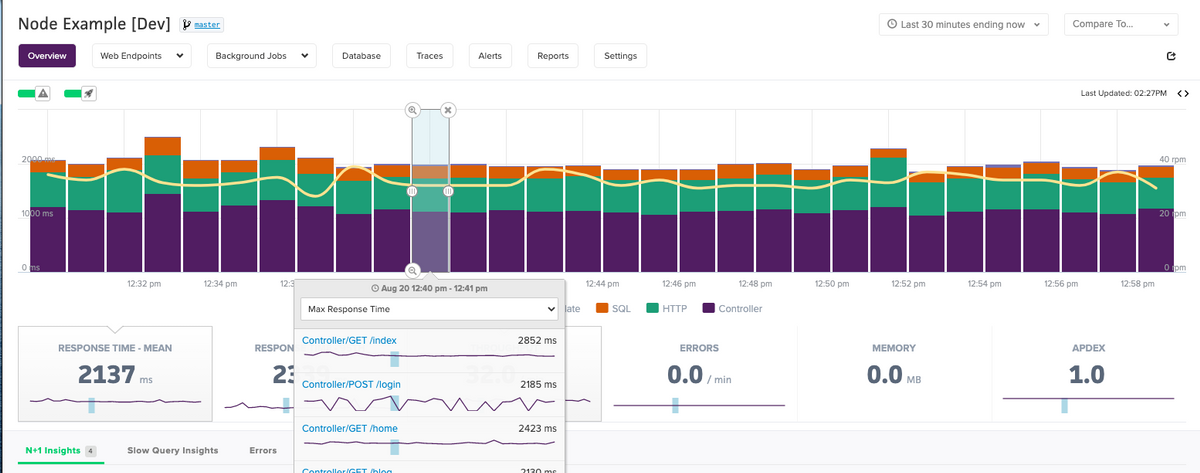
The chart is highly configurable, allowing you to change and compare dates and time periods, as well as toggle which metrics you want to see. It also features a neat drag-and-drop tool (shown below) that allows you to draw a box around areas you wish you explore in more detail. A pop-up window will dynamically load as you draw these boxes, showing all the endpoints that were accessed during this time period. This can be particularly useful when you see a performance spike on the chart and you want to see what caused it.
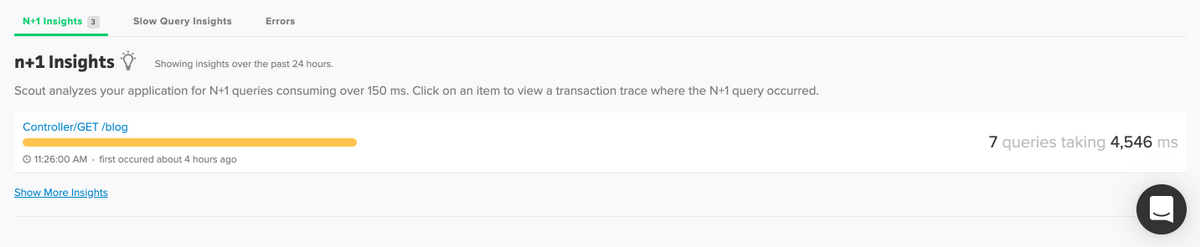
Insights tabs
Whether you are veteran of Scout or just using the platform for the first time, one of the areas we highly suggest you take a look at is the insights tabs — N+1 Insights, Slow query Insights, and Errors. Here we have a set of algorithms which analyze your project to identify potential n+1 queries and slow queries. These offer you the “low-hanging fruit” of performance fixes that can often instantly improve your application’s performance.
Endpoints and Traces
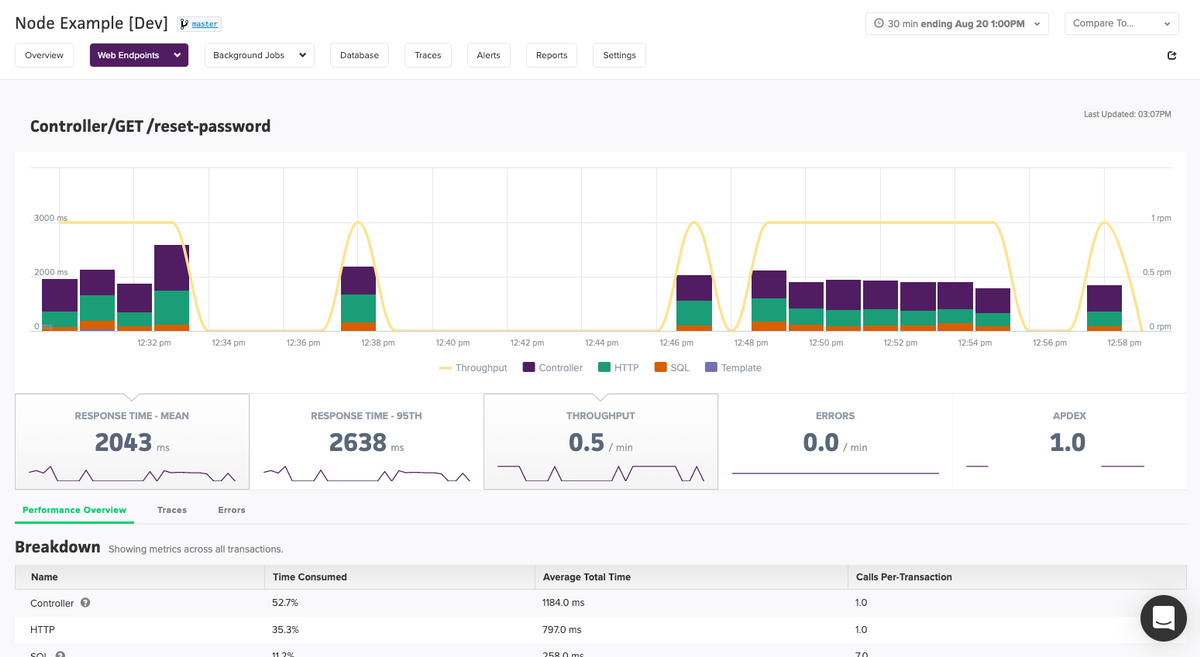
When we take a look at performance metrics, we find that there are two levels to which Scout provides us information. The higher overview level is what we call endpoints. For example, on average, how long does this endpoint take to access and what is the breakdown of where time was spent?
If you take a look at the screenshot below, you can see a couple of occasions where the reset password endpoint was accessed. In this example 52.7% of the 2043 ms mean request time was spent in the controller layer. Depending on your architecture, 1000ms in the controller could be an indication that this area needs to be investigated as to why this endpoint is sluggish. It is interesting to note too, that performing an http call in our controller takes a long time as well. That could also be an area to investigate as well. Maybe it could be put into a background job?
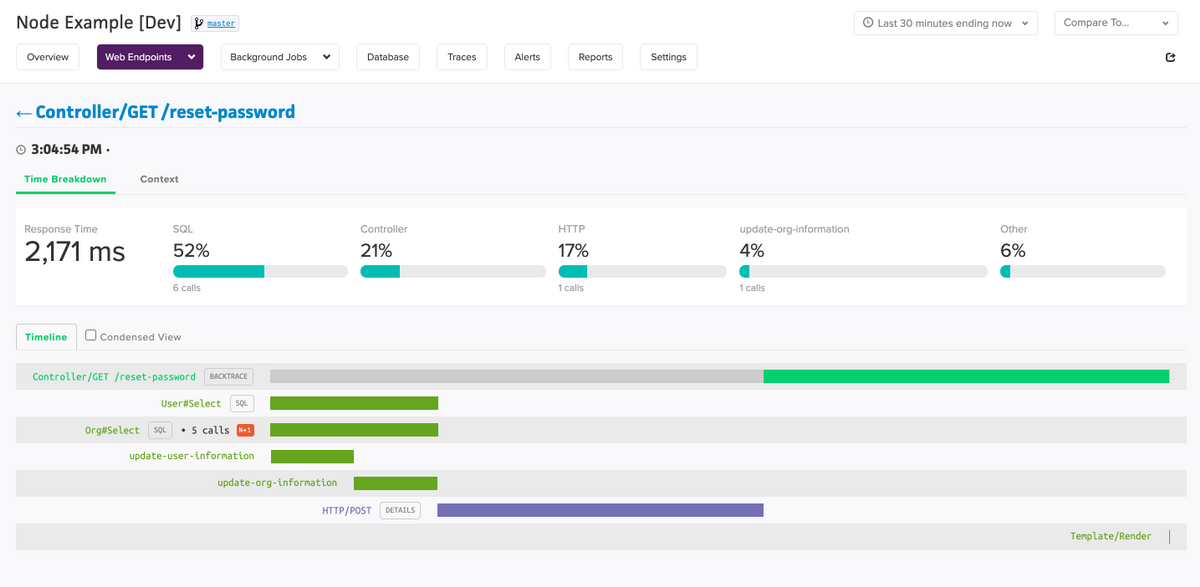
The more detailed perspective that Scout presents metrics on is at the trace level. For example, during this particular web request that somebody made, how long did it take to complete, and which levels of the request consumed the most time etc. If we take a look at one of the traces in the reset-password controller below, we can see that for this particular case 52% of time was spent in the SQL layer. Which we see is much longer than the average time spent in SQL that we saw above.
This could indicate that this is a large user, and that large users, or enterprise users, have a much longer wait time than the average user. If we click that SQL button we can see a backtrace and see if we can perhaps improve the query. Another interesting thing to note is how long update-user-information, and update-org-information takes. I suspected some of the code that I had in the controller was slow, so I wrapped around those code blocks to diagnose them more using custom instrumentation. The results show that those are areas that could use some improvement as well.
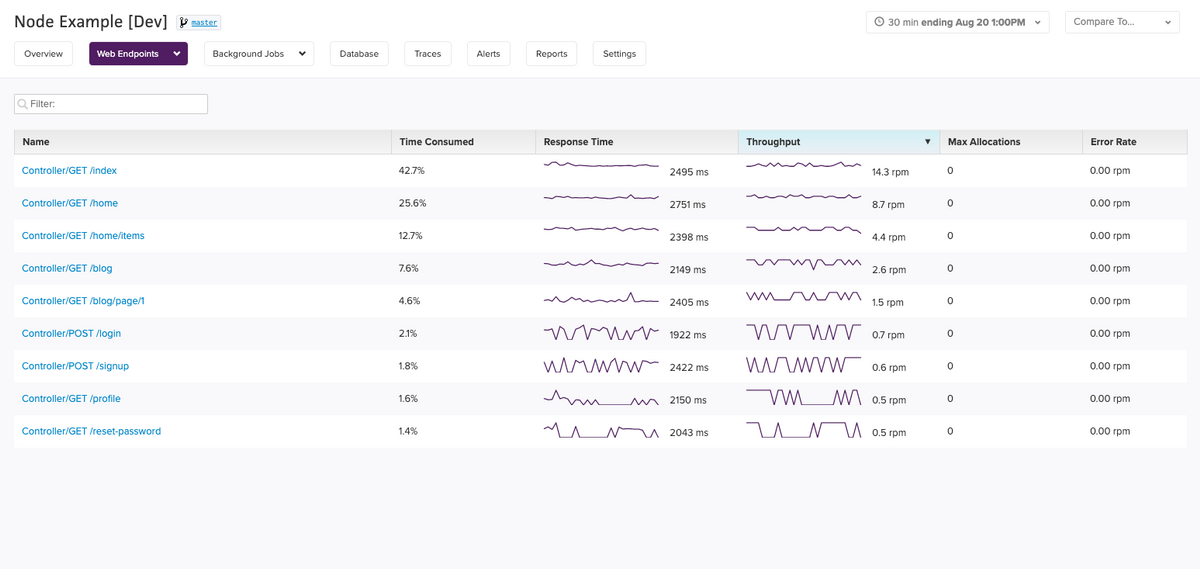
These trace and endpoint pages are where you will spend most of your time in Scout, and they give you the sort of visibility that is essential when trying to understand your performance issues. You can reach Endpoint and Trace pages either by coming directly from the main overview page and insights tabs, or by clicking on the Web Endpoints link at the top of the page (shown below).
Beyond the basics
Now that we’ve covered the basics of Scout and shown you the main areas of the system that you would typically use day in, day out, let’s now switch our attention to some of the more advanced features which put Scout ahead of the crowd in the APM space.
Custom Context and Trace Explorer
Why does this performance issue only happen at 2:00AM on Tuesday night from a Brazlian IP address? These kinds of difficult (but common) performance issues can be tackled with one of the most powerful features of Scout: the trace explorer being used in conjunction with user defined custom context.
Used defined custom context allows you to tell us what you need to see. And it is well worth investing the relatively small amount of time it will take you to set up to be granted monitoring superpowers! By default the only context fields you will see are URI and Hostname, as you can see below, but these can be customized to anything that you want.
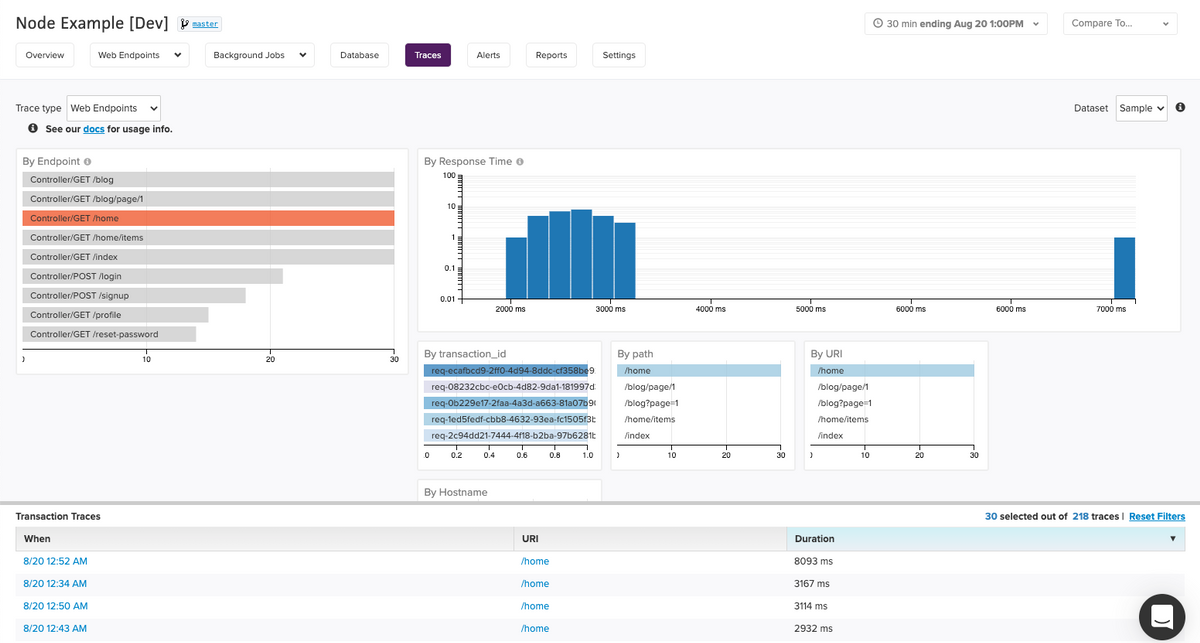
The trace explorer’s multi-filter charts (shown above) allow you to examine endpoints that match criteria that you have defined, and then you can see all the traces that match these filters in the Transaction Traces part of the screen. For example, perhaps you want to see the web requests of a certain user, or of all users on a certain plan size, or from a certain part of the world. These sorts of operations are easy to do in the trace explorer with custom context, and they help you to get to the bottom of those hard-to-diagnose, time-consuming performance issues.
Deploy tracking
Ever wondered what the experience is like after you have deployed? Curious whether that change to the SQL query added a lot overhead? All of these answers can be obtained when adding our deploy tracking feature. This features will place a rocket symbol on the main overview chart to indicate when a deployment occurred.
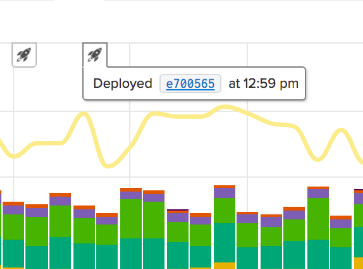
Deploy tracking also allows you to see details such as how many commits were involved in the deploy and which branch the commits came from. We can glean all this information when you add the SHA or your deployment to the SCOUT_REVISON_SHA environmental variable.
Alerting
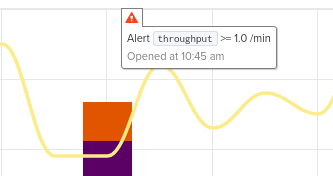
Like all good monitoring solutions, Scout provides you with a sophisticated alerting system which can be configured to send certain people alerts when endpoint response times or memory usage metrics go over a certain threshold. These alerts will appear as warning symbols on the main overview chart, and notifications will be sent out.
By default, the alerting system will send notifications to users in notification groups via email, but it can also be configured to work with third party services such as Slack, VictorOps, PagerDuty etc. with our webhook feature.
Custom Instrumentation
Interested in getting more insight into your Express auto instrumented, or manually instrumented, web endpoints and background jobs? Are you interested in seeing which actual code blocks in your controller are the reason for your long response times — as seen in our reset-controller example (Second screenshot in Endpoints and Traces)? Take a look into adding additional instrumentation. This powerful feature allows you to gain insight into which code blocks are actually causing your endpoints and background jobs to perform slowly.
Are you using libraries outside of Express that we don’t currently auto instrument? If so, mention it on our next frameworks community thread or reach out to us in support. In the meantime you can add some custom instrumentation yourself, it’s really easy to get started, and it will ensure that you have full visibility of your whole application.
What’s next?
As you can see, Scout APM brings a very mature APM monitoring solution to the Node.js and Express communities. Our clutter-free UI and deep instrumentation help you get right to the heart of your performance issues quickly, while remaining affordable due to our flexible transaction-based pricing structure.
Start your free 14-day trial today to try out our new Node.js monitoring agent firsthand, no credit card required.