
Vitals 1.9 has a Process Inspector. Click any process on your Mac and Vitals tells you what it is: the app it belongs to, who signed it, what started it, and everything it has used since.
If you missed the launch, Vitals is an Activity Monitor alternative for Mac. It groups every process under the app it belongs to, so you see about 60 apps instead of 1,000 processes. I wrote about why I built it when it came out.
1.9 shipped on October 31. I was busy with the fixes that came after it and never wrote it up, so here it is, with the Terminal commands for each question too.
Why Activity Monitor isn’t enough
Activity Monitor gives a process a name and a number. When the name is com.docker.backend or postgres, that is not much to go on.
The questions are always the same. What app is this from? Who made it? What started it, and will it come back if I quit it? Has it been sitting there for two weeks? Activity Monitor’s Inspect window answers a few of them. The rest meant Terminal: ps, codesign, launchctl and lsof, one at a time.
Vitals already knew most of this, to group processes under their apps. 1.9 shows it.
What the Process Inspector shows
Click any process in Vitals and a drawer opens beside it.
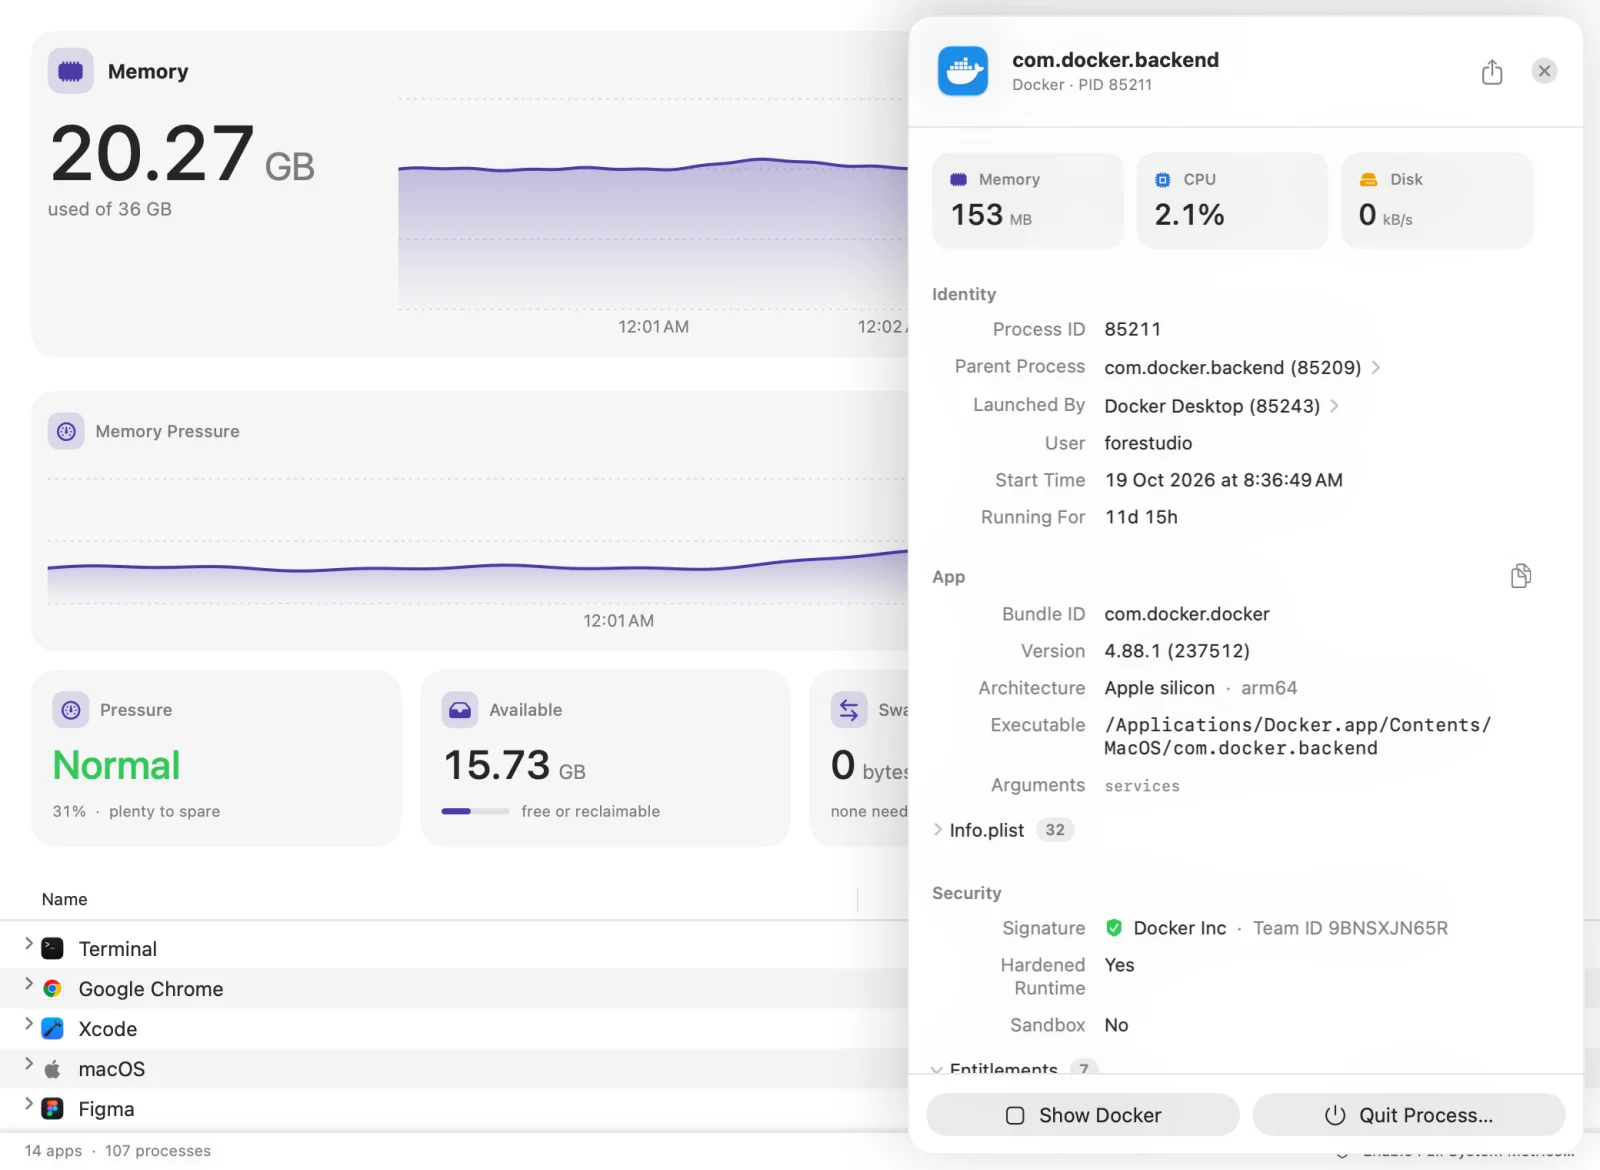
At the top are its memory, CPU and disk right now. Below that:
- Identity. Its process ID, its parent process, what launched it, the user it runs as, and how long it has been running.
- App. The app it belongs to, with its bundle ID, version, architecture, the full path and the arguments it was started with. The whole Info.plist is one click away.
- Security. Who signed it and their Team ID, whether it has the hardened runtime, whether it is sandboxed, and its entitlements.
- Resource usage. What it has used since it started, not just this second.
- Network. Its download and upload, and the ports it is listening on.
- Child processes. What it started.
Click a parent or a child to follow it. That is how you get from a helper you don’t recognise to the app that owns it.
How to see what started a process on Mac
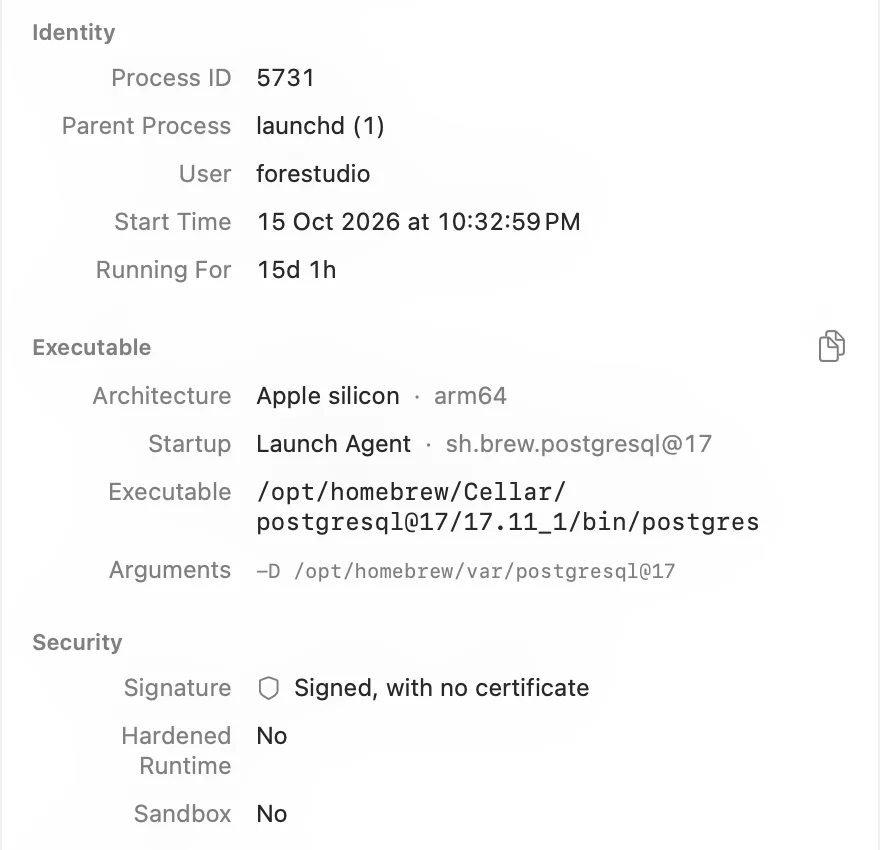
This is a postgres I installed with Homebrew. It has been running for 15 days. Its parent is launchd, and the Startup line says why: a launch agent, sh.brew.postgresql@17. Quit it and it comes straight back. To stop it for good, you stop the launch agent, here with brew services stop postgresql@17.
In Terminal, the parent process, start time and path come from ps. Replace 1234 with the process ID:
ps -o ppid=,lstart=,comm= -p 1234A parent of 1 is launchd, which starts most background processes. To see whether one of your launch agents started it, look for its process ID in launchctl list:
launchctl list | awk '$1 == 1234'The third column is the launch agent’s name. That only finds your own agents. Vitals shows the same on the Startup line, for launch daemons and an app’s own agents too.
How to check who signed a process on Mac
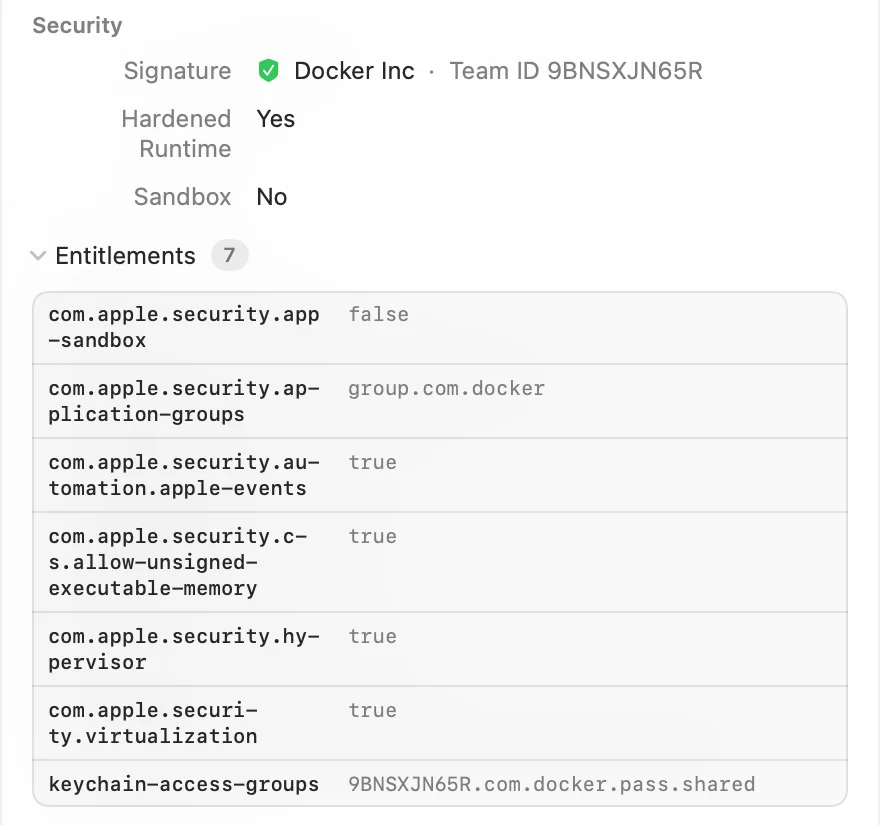
A signature with a Team ID tells you who made it. The entitlements tell you what macOS lets it do. Docker asks for the hypervisor and for virtualization, which is what you would expect from something that runs Linux on your Mac. If a process you don’t recognise asks for things like that, you want to know.
In Terminal, codesign reads both from the process’s executable:
codesign -dv --verbose=4 "$(ps -o comm= -p 1234)" 2>&1 | grep -E "Authority|TeamIdentifier"
codesign -d --entitlements - --xml "$(ps -o comm= -p 1234)"
The first prints who signed it and their Team ID. The second prints its entitlements as XML. Vitals shows both as a list, with a green check when the signature is valid.
How to see how much a process has used since it started
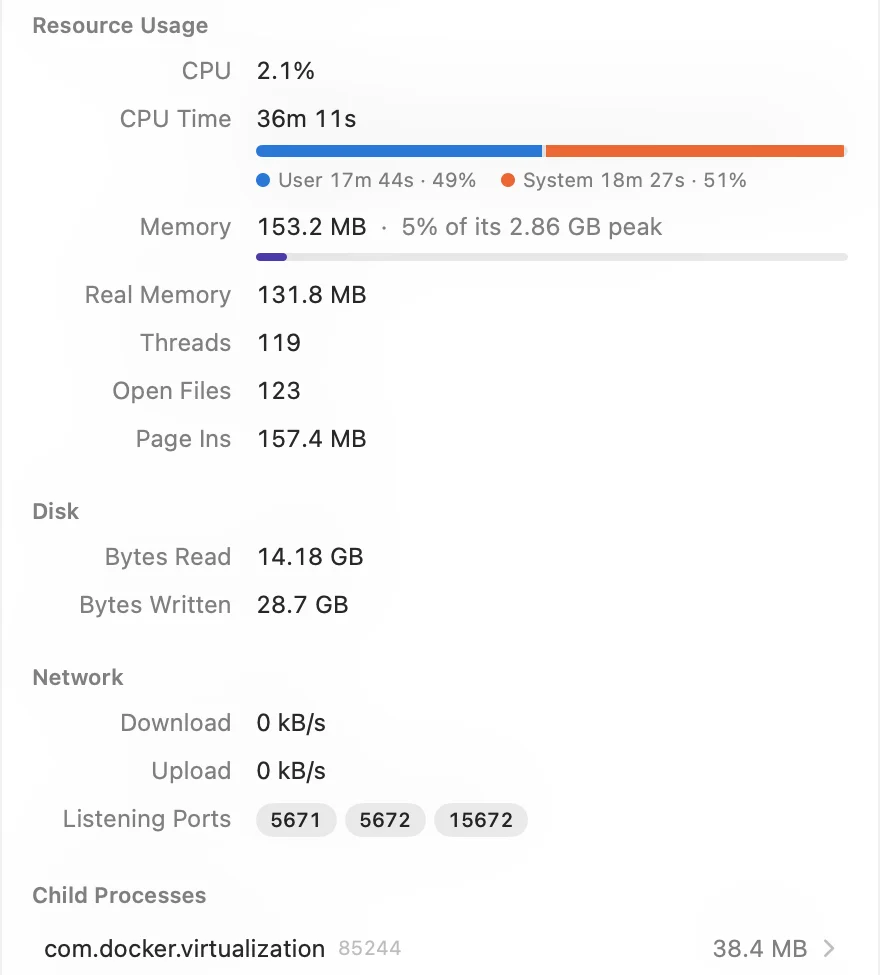
Activity Monitor shows what a process is doing now. Vitals also shows what it has done since it started: CPU time, split into user and system, memory now against its peak, threads, open files, and bytes read and written.
Here, Docker’s backend is at 153 MB, but it once reached 2.86 GB, and it has written 28.7 GB to disk. Neither shows up in a list sorted by what is happening this second.
ps -o etime=,time= -p 1234 gives how long it has run and its CPU time. ps has no peak memory and no bytes written. Vitals reads those from macOS for every process, and draws a live chart of its CPU and memory while the drawer is open.
How to see which ports a process is listening on
The Network section lists them. In Terminal:
lsof -a -nP -p 1234 -iTCP -sTCP:LISTENThe -a matters: without it, lsof also lists everything else listening on your Mac.
More in Vitals 1.9
- A Details card for every app. An app’s drawer shows its version, bundle ID, architecture, signature, what starts it, how long it has run and where it is installed.
- What just started, and what just ended. A process that started seconds ago gets a New mark. Ended Recently keeps what ended in the last ten minutes, so a helper that crashed is still there to look at.
- Copy it, or save it as CSV. Any drawer can be copied as text for a bug report, or saved as a CSV file.
- Five new columns. PID, User, Start Time, Version and Path can join the app table, from the Columns menu in the toolbar.
- Regular expressions in the filter. Type a pattern between slashes, such as
/helper|agent/.
The same in one command, and for AI assistants
Vitals has its own command, so you don’t need the ones above. vitals process postgres gives everything in the drawer, by name or process ID. Add --json for JSON, --env for the environment and --plist for the Info.plist.
Claude, Codex and Cursor get the same details through Vitals’ MCP server, without the environment, since it can hold keys. And vitals top --at 14:02 tells you which apps used the most at that time, so a spike in the history has names next to it.
Does it work on my Mac?
Vitals runs on macOS 15 Sequoia or later, on Apple silicon and Intel Macs. The Process Inspector is in 1.9 and later; the current version is 1.9.4.
How to get it
The update is free for everyone who owns Vitals. New to Vitals? Get it for Mac, or try it free for 3 days first. There is a page for the Process Inspector and one for the release.
If it shows something wrong, or something you wish it showed, email me.